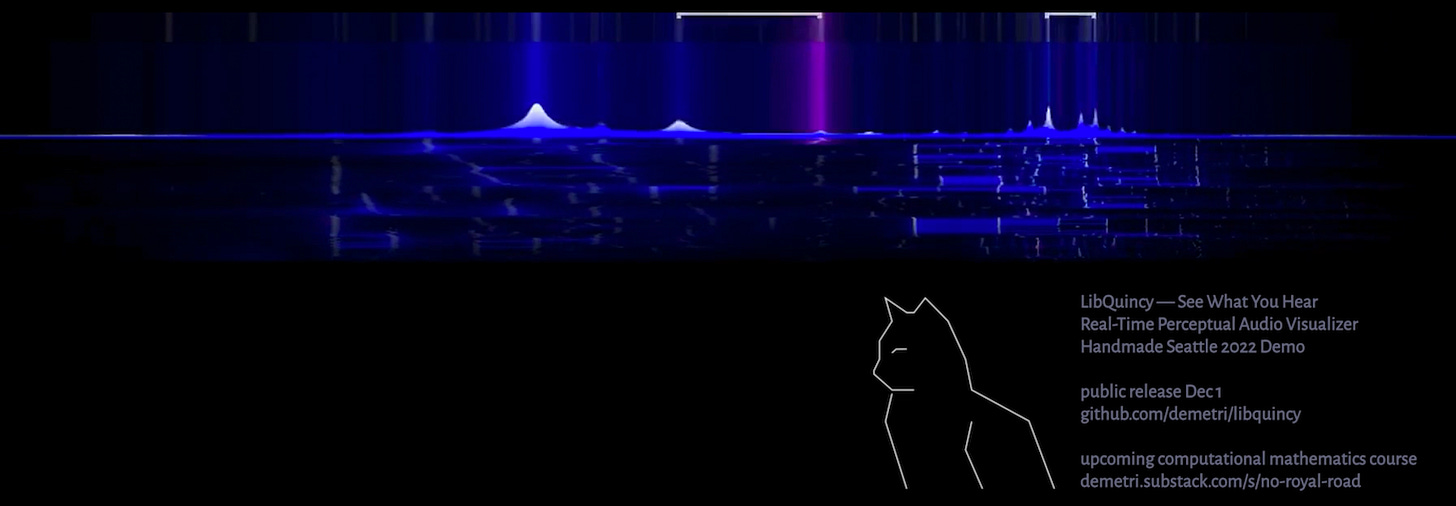
I just did a demo of LibQuincy, an audio visualizer focused on human perception, at Handmade Seattle 2022. [Dec 1 Update: You can now watch the full-resolution conference video.]
You can see some technical details at the GitHub link, but here I want to talk about LibQuincy’s relationship to my upcoming interactive mathematics education project: No Royal Road (NR2).
First, two background points
NR2 is, for lack of a better genre term, a “math game” that will have an Early Access release sometime around Q2 2023. I will probably do a crowdfund for it in the interim. If any of this interests you, you can follow these posts on Substack, or RSS. You can also follow me on Twitter for math / science / education / programming discussion.
NR2 will have many subsystems that I will release as open source as they are finished. LibQuincy is the first such system. In the future I will also, at a minimum, eventually release the mathematical typesetting and text rendering system (a lightweight alternative to LaTeX designed specifically for interactive media).
LibQuincy fell out of making NR2 because I wanted an interactive, intuitive, demonstration of various abstract concepts of linear algebra. This subject is actually fairly deep, but I can give you a small taste quickly: in the same way that you can move North or South without moving East or West, you can hear a high frequency while simultaneously hearing a low frequency. This is a generalized concept of orthogonality that lifts us from spatial metaphors of right angles, and moves us to broader principles like separation and independence. Indeed this generalized idea of orthogonality is the foundation for Fourier Series, and almost all image and video encoding.
While LibQuincy started as a simple byproduct of NR2, it revealed an opportunity to design an audio visualization library based on human perception. At the risk of overgeneralizing, most spectral visualizers are oriented either around mathematical concerns like signal representation, or around sound engineering concerns like filtering. These are important activities, but I’ve always found them insufficient in service of Quincy’s mission statement: “See What You Hear”. This has led to much productive reading on human sound perception, how best to represent that with mathematical tools, and with tools of visual design. Again, you can see technical details at the GitHub project.


That LibQuincy is gorgeous! And tiny! I may try to use it to create a visualisation of my choir, to help people "see" their voices better!